


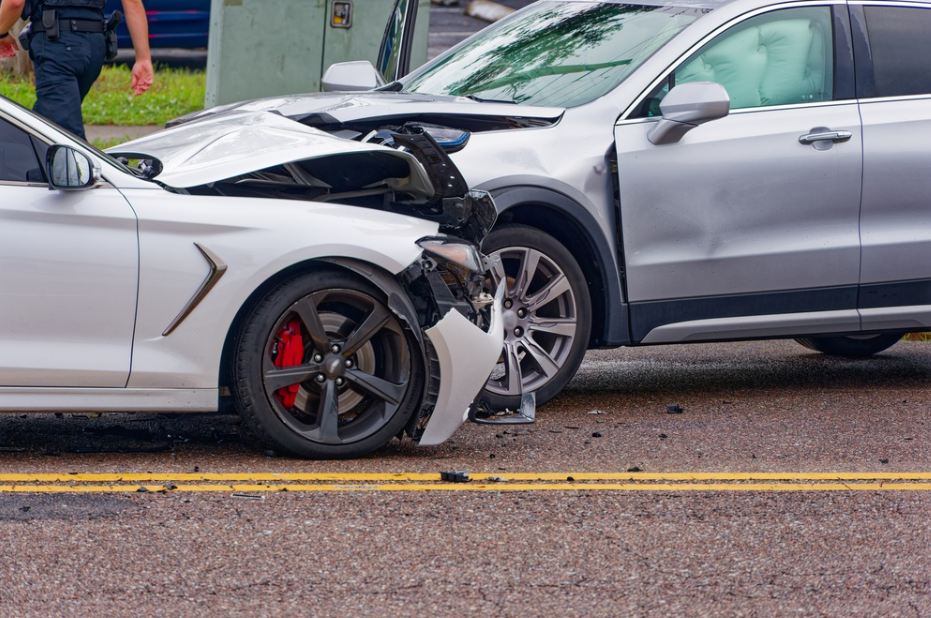
Roads keep changing, but the numbers behind crashes tell a story that a single year cannot show. A decade and a half of records reveal periods of progress, sudden setbacks, and risks that have not gone away. Traffic deaths fell during the early 2010s, rose sharply around 2020 and 2021, and then declined again. These shifts deserve a closer look because they show more than how many people died. A review of 15 years of car crash data in the USA also brings driving habits, traffic levels, vehicle safety, and road design into focus.
How Crash Numbers Have Changed Over 15 Years
Federal records show that 32,999 people died in U.S. traffic crashes in 2010. The number fell to 32,479 in 2011 and stayed close to that level through 2014. The trend then changed. Fatalities rose to 35,484 in 2015 and reached 37,806 in 2016. The total moved down slightly over the next few years, reaching 36,355 in 2019.
The sharpest rise came during the pandemic period. The country recorded 39,007 traffic deaths in 2020 and 43,230 in 2021, the highest figure in this 15-year period. Deaths then declined to 42,721 in 2022, 40,901 in 2023, and 39,254 in 2024. These figures count people killed in traffic crashes, not every reported collision.
Traffic Deaths and Fatality Rates Tell Different Stories
A death total gives one view of road safety, but a fatality rate adds useful context. It compares deaths with the number of miles people travel. In 2010, the U.S. rate was 1.11 deaths for every 100 million vehicle miles traveled. It reached 1.08 in 2014, then climbed to 1.38 in 2021. By 2024, it had fallen to 1.19.
This difference matters because Americans do not drive the same number of miles every year. More travel can mean more chances for crashes. Looking at both deaths and the rate per mile gives a fairer picture than using the death count alone. Injury totals also need separate attention because a crash can cause serious harm without resulting in a death.
Common Types of Car Crashes Across the Country
Crash reports include several kinds of collisions, and each can point to different road risks. Common types include:
- Rear-end crashes: These often happen in slow or stopped traffic when a driver fails to brake in time.
- Intersection crashes: Turning vehicles, red light violations, and missed signals can lead to serious impacts.
- Side-impact crashes: These can be dangerous because the sides of vehicles offer less space to absorb a hit.
- Single-vehicle crashes: A car may leave the road, strike an object, or roll over after the driver loses control.
- Multi-vehicle crashes: Sudden slowdowns on busy highways can lead to chain reactions involving several vehicles.
The number of each crash type can change by state, road design, and traffic level. National totals do not mean every community faces the same risks.
Driver Behavior Behind Changing Crash Trends
Driver choices remain a major part of road safety. Speeding gives drivers less time to react and makes a crash more forceful. Distraction, including phone use, can take attention away from signals, other vehicles, and people crossing the road. Alcohol and drug use can also affect judgment and reaction time.
Seat belt use has a direct effect on crash outcomes. A seat belt helps keep a person inside the vehicle and can reduce the chance of serious injury. These behaviors may help explain why fatality numbers change even as vehicles and roads improve. A safer car cannot fully protect someone from a high-speed impact or an inattentive driver.
Differences in Crash Trends Across States: High Speeds
Traffic safety does not look the same across the country. States with long rural highways may face risks linked to higher speeds and longer distances between emergency services. Large cities may see more traffic near intersections, busy roads, and construction areas. Weather also plays a part, as snow, rain, fog, and ice can affect visibility and tire grip.
For a fair state comparison, crash totals should be considered alongside population, licensed drivers, and miles traveled. A state with more residents may record more crashes, while its rate per mile or per person may tell a different story.
How Vehicle Safety Improvements Affect Outcomes
Modern vehicles include safety features that were less common fifteen years ago. Airbags, stronger frames, seat belt reminders, and electronic stability control help protect people during certain crashes. Newer models may also include automatic emergency braking, blind spot alerts, and lane departure warnings.
These systems can help prevent some collisions or reduce their force, but they do not make driving risk free. Their value depends on proper use, road conditions, and the limits of the technology. Vehicle safety is only one part of the wider picture, alongside careful driving and well-designed roads.
What the Numbers Tell Us
The past 15 years show that road safety can improve, decline, and improve again. The rise in deaths around 2020 and 2021 stands out, while the decline through 2024 offers a different signal. Still, 15 years of car crash data in the USA show that progress cannot be measured by one number alone. Fatalities, travel rates, crash types, driver behavior, and vehicle safety all matter when judging the condition of American roads.


